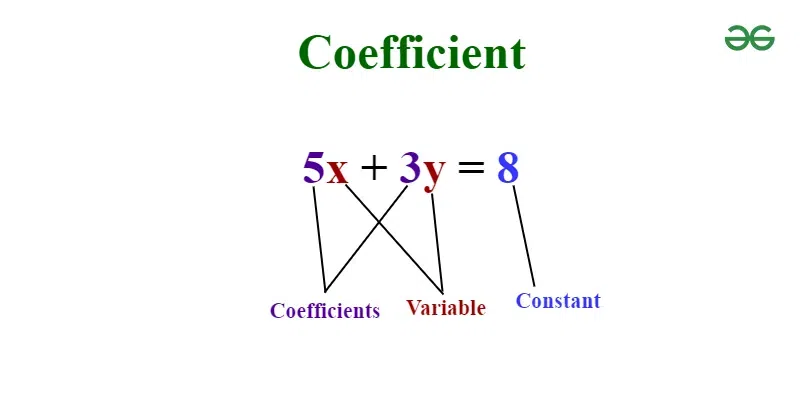
Railway Accounts Department Examinations

Showing posts with label Freight. Show all posts

Friday, July 25, 2025

Rail Coefficient


Rail Coefficient

What is Coefficient ?


  • In simple terms, a coefficient is a number (or a symbol representing a fixed number) that is multiplied by a variable in a mathematical expression or equation.

  • 5X + 3 Y = 8  (5 and 3 are variables, 8 is constant. X & Y are Coefficients. 

📊 What Is the “Rail Coefficient”?

The rail coefficient represents the percentage share of a specific cargo (e.g., automobiles or containers) moved by rail rather than road.

Key Points:

  • Formula: Tonnage moved by Rail / Tonnage moved by Rail & Roads x 100 

  • Expressed in percengage

  • Indicator of modal share: It quantifies how much of the transport load has shifted from road to rail.  

  • Environmental and operational gains: Higher rail utilization helps cut road congestion, reduces transport costs, shortens transit times, and supports India’s emissions‑reduction goals

🚆Practical Example: IR Annual Magazine June, 2025: Dramatic increase in rail coefficient: The share of automobile (especially passenger vehicle) traffic carried by rail rose from 1.5% in 2013–14 to 24.20% in 2024–25, a significant shift reflecting greater reliance on rail for auto logistics.

  • Success driven by reforms: This growth stems from policy liberalization under the AFTO scheme, reduced rake requirements, eased registration, and streamlined operations. New loading terminals and modern multi-deck wagons (BCACBM, ACT1/2) have enabled efficient handling of SUVs and cars.

  • Sector-specific metric:

    • For automobiles, this reflects the proportion of total vehicle production dispatched via rail — recently climbing from 1.5% in 2013–14 to over 24.20% in 2024–25

    • For containers, it signals the shift in logistics patterns — for instance, the rail coefficient reached 26.70% in FY22, aided by dedicated freight corridors 

🎯 Why the Rail Coefficient Matters

  • Policy impact metric: Reflects the success of reforms like AFTO, infrastructure expansion, and double-stack wagons in shifting freight from road to rail.

  • Efficiency gauge: Rail is often more cost-effective and eco-friendly over long distances — a rising coefficient signals a positive efficiency trend.

  • Strategic indicator: Helps Indian Railways and logistics planners assess and prioritize investments in terminals, wagons, and corridors.

  • Environmentally relevant: Aligns with emissions targets by diverting high-tonnage freight from trucks to electric or diesel-electric trains.


📌 Summary

  • The rail coefficient is a quantitative measure of the shift in freight from road to rail.

  • The rise from 1.5% to 24.2% (in Automobile Traffic) over a decade is a resounding success story for policies, infrastructure development, and operational improvements within Indian Railways.

  • Continued emphasis on modern terminals, double-stack operations, and stakeholder-friendly policies is expected to raise the coefficient further — a strategic win for cost efficiency, environmental sustainability, and rail’s modal share.


Wednesday, May 31, 2023

Freight Target 2024 MT - Year 2024 - Vision 2024


Vision 2024  - Year 2024 - Freight 2024 MT 


  • FY 2023-24 - Target 2024 Million Tonnes  (as per Vision 2024 document - click here


  • FY 2022-23 - Actual Freight - 1512 MT (Target is 1700 MT)


  • 5.5 MT per day - Ambitious target fixed by Indian Railways (in 2022-23, it was 4.15 MT per day)  - Expected a tremendous growth rate of 32 % 


  • Coinciding the Year 2024 with a target of 2024 MT


Year

Freight Loading

     (in MT)

%

2017-18

1160


2018-19

1222

5 % increase

2019-20

1208

1 % decrease

2020-21

1231

2 % increase

2021-22

1418

16 % increase

2022-23 (Target)

1512

7 % increase

2023-24 (Target)

2024

32 % increase


  • Target for Indian Railways   - modal share of 45 % of Total Freight Traffic by the Year 2030  as per NITI Aayog  ( In 2018-19 IR’s modal share is 27 % only)    


 Share - Mode of Transport  - 2018-19 Year


Mode

Share 

Tonnes 

(in Millions)

Roads

64 %

2912

Railways 

27 %

1222

Coastal Shipping

5 %

234

Pipeline

2 %

84

IWT - Inland Water Transport 

2 %

72

Total

100 %

4524


Key Points for MCQ 


  1. 2022-23 Actual Freight - 1512 MT  (against the target of 1700 MT)

  2. 2023-24 Freight Target - 2400 MT  

  3. 2030 Year - Target 45 % of Total Freight Traffic (at present 27%) 

  $$$$ end $$$